Dimensional Control - Computer Vision & IoT
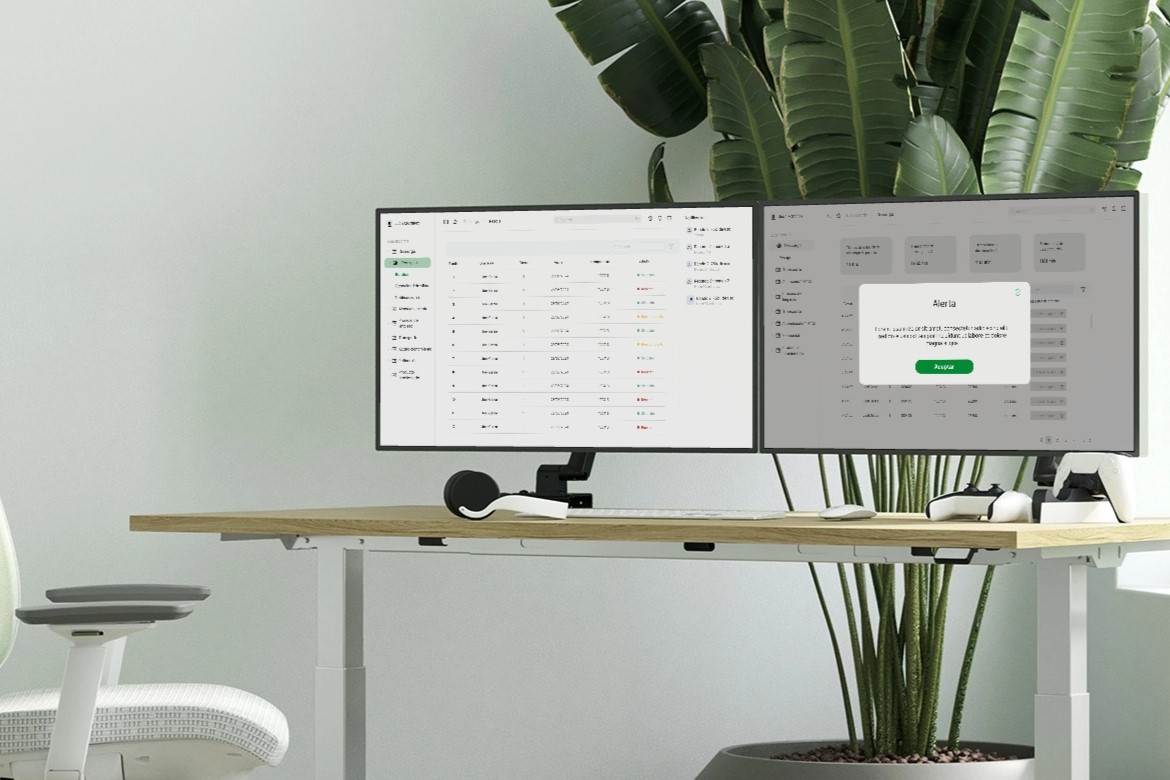
In this project, I designed and developed a dashboard utilizing artificial intelligence and computer vision to measure the company's coils. The objective was to create an efficient, user-friendly interface that provides accurate, real-time data for monitoring coil measurements. This involved extensive user research, iterative design processes, and close collaboration with the development team to integrate advanced AI and IoT technologies seamlessly.

Challenges and Objectives
The project aimed to develop a dashboard leveraging artificial intelligence and computer vision to measure the company's coils. The primary challenges included accurately capturing and analyzing data from the coils, ensuring real-time processing, and presenting the information in a user-friendly manner. The objectives were:
- To create a seamless and efficient user experience for monitoring and measuring coils.
- To integrate AI and IoT technologies effectively within the dashboard.
- To ensure data accuracy and reliability in measurements.
Design Process
Research
The project began with a series of discovery and empathy workshops, utilizing Design Thinking principles to understand the requirements, gather knowledge, and align the team. These workshops helped us identify user needs and pain points, setting a solid foundation for the design process. Additionally, I conducted user interviews to gather direct insights and validate assumptions about user behavior and expectations.

Wireframing
Using Adobe XD, I translated my initial sketches into low-fidelity wireframes. These wireframes provided a basic layout and structure, focusing on user flow and functionality. To make the wireframes more realistic, I added relevant stock images and copy provided by the marketing team. At this stage, the wireframes were detailed enough for preliminary user testing. Based on feedback from four user tests, I iterated on the design, addressing usability issues and refining the flow.
Prototyping
Moving from wireframes to high-fidelity prototypes, I enhanced the visual and interactive elements to create a more polished representation of the dashboard. The prototypes allowed for more in-depth user testing and validation of design choices. This iterative process ensured that the design was both functional and visually appealing.
Visual Design
In the final phase, I used Figma to design the high-fidelity screens. The goal was to create a visual identity aligned with the brand's values and message. I aimed to craft a visually striking yet intuitive interface that facilitated ease of use and efficiency. I reviewed competitors and referenced design catalogs for inspiration, ensuring that the final design was both innovative and user-centric.

Key Features
- AI-Powered Measurements: Utilizing artificial intelligence to provide accurate and real-time measurements of the coils.
- User-Centric Dashboard: A clean and intuitive interface that allows users to monitor coil data effortlessly.
- Interactive Visuals: Engaging and interactive visual elements to help users understand and analyze data effectively.
- Real-Time Data Processing: Ensuring that users receive up-to-date information without delays.
- Responsive Design: Adaptable across various devices and screen sizes for consistent user experience.
Project Outcome
The final dashboard successfully integrated AI and computer vision technologies to provide accurate and real-time measurements of coils. User feedback highlighted a significant improvement in efficiency and usability, meeting the project's primary objectives. The dashboard not only facilitated better monitoring and measurement but also enhanced the overall user experience.

Conclusion
What did I learn from this project?
This project provided deep insights into the integration of AI and IoT within a user-friendly interface. I learned the importance of iterative design and continuous user feedback in creating a functional and efficient product. The experience reinforced the value of empathy and user-centric design principles in solving complex technical challenges.
What were my biggest fears, challenges, and struggles?
One of my biggest fears was ensuring the accuracy and reliability of AI-powered measurements within the dashboard. I also faced challenges in creating an interface that was both visually appealing and highly functional. Balancing technical complexity with user-friendly design was a constant struggle.
How did I overcome them?
I overcame these challenges by maintaining a close collaboration with the development team and continuously testing the design with real users. Iterative feedback loops and a willingness to adapt based on user input were crucial in refining the design and ensuring its success. Being transparent about challenges and actively seeking solutions helped me navigate the complexities of the project effectively.

If you're looking for a UX/UI designer who can create intuitive and engaging user experiences, I'd love to collaborate with you. Let's work together to bring your vision to life. Contact me to discuss how we can make your next project a success!


